


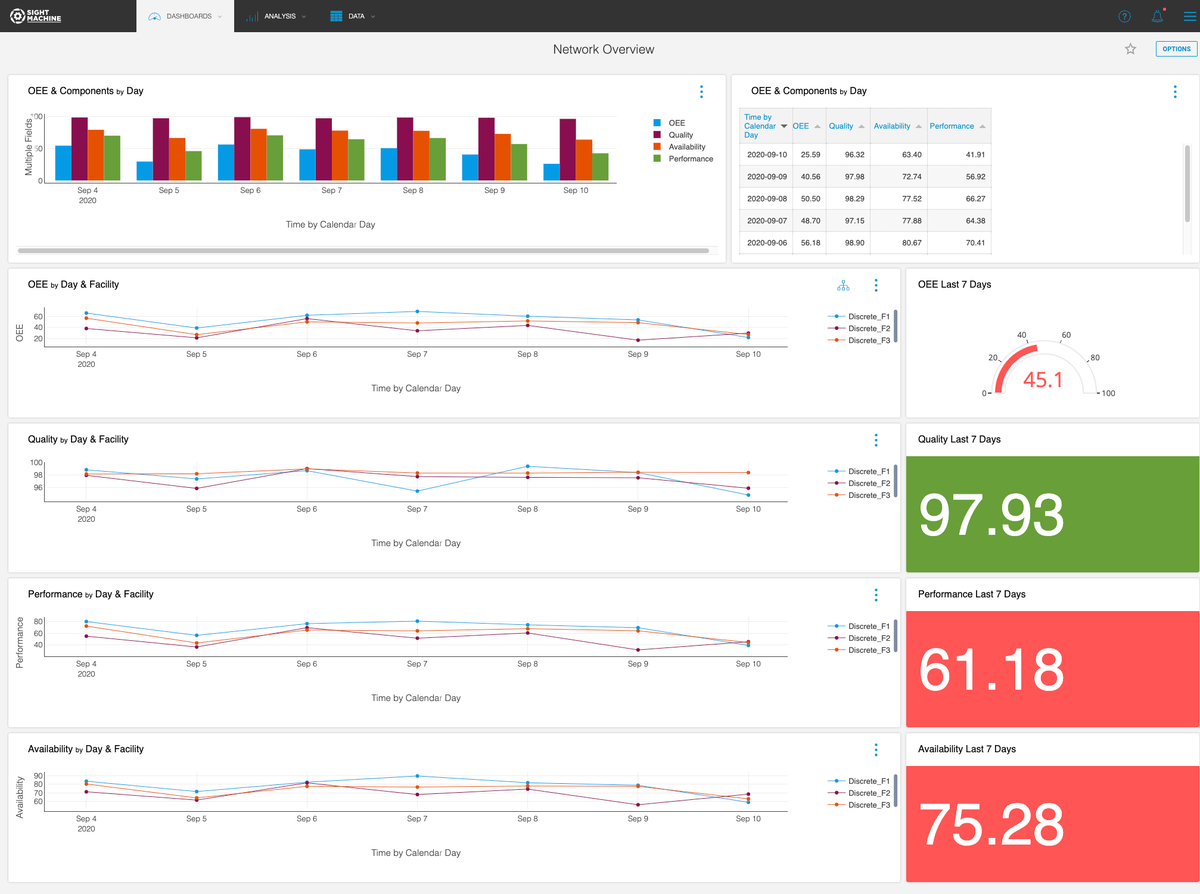
We previously announced the release of our KPI Dashboard for manufacturing as part of our Fall 2020 product release. A better way to track KPIs is a common customer request. Every manufacturer tracks KPIs. The success of CIOs and COOs is measured by whether they can meet or exceed KPI targets. Operators on the shop floor have basic KPIs around the amount they produce. Still, the reality in manufacturing is that granular KPI performance has been challenging due to critical limitations around data.
This KPI Model finally allows manufacturing teams to measure, visualize and track KPIs in ways that were never before possible – from hour to hour, product to product, shift to shift and even compare KPIs across all production data. Or a manufacturer can compare KPIs by suppliers to see how production inputs impact process KPIs. Ultimately, the KPI Dashboard for Manufacturing is the most complete realization of the 4M (Man, Machine, Material, Method) Lean Manufacturing analysis methodology, bringing the capability to any of the four across any variable or parameter into one manufacturing productivity platform. So, what novel capabilities does this provide in practice?
- Compare the impact of external factors like humidity on KPIs
- See what your most product shift crews are doing differently and better
- Track the impact of input quality variation from different suppliers on KPI performance
- Understand how changing operating settings on assets impacts KPI performance
On the shop floor, plant managers and OT teams can build KPIs based on each asset’s theoretical max and historical performance. This capability allows fair and objective apples-to-apples comparisons across assets of different age, capacity, or speed. Even better, the KPI Model measures each operator’s KPI progress in real-time. This helps operators understand precisely where they stand and offers them insights into the most common problems their line has recently faced (types of machine outages and error codes).
The KPI Model allows managers to finally switch from the big picture to the very small picture and back with a single click. Using saved reports and dashboards, managers can easily zoom out to track KPIs across machines, lines, plants, or (for CEOs, COOs, and CFOs) even globally across networks of factories. Most crucially, KPI Models give manufacturers a powerful new tool to identify opportunities to improve productivity at every level of the production process.
Why Tracking Granular KPI Data Has Been Hard Until Now
The data diversity problems facing manufacturers have long made it hard to acquire accurate and super-granular KPI data.
Retrieving accurate real-time production process data was difficult due to the challenges in working with the data. Many systems required specialized knowledge to write queries to retrieve data. In most plants, only one or two team members could write SQL or Python queries. Wrangling the data exported was time-consuming, often taking weeks, and usually running in spreadsheets. This discouraged teams from aggressively accessing data and using it to answer questions or make granular measurements like real-time KPIs.
Making sense of production process data was hard. Even if you could collect all the data and put it into a spreadsheet, you still faced a considerable challenge of making sense out of the data. You had to normalize the different data formats into a coherent digital picture of what is happening in a plant, second by second, hour by hour, and day by day. Some data, such as quality data, arrived late and was difficult to incorporate. Other data came in incompatible formats – SQL data and streaming-data from time-series to name two. Sometimes data was changed after the fact, requiring backward-looking recalculations that create challenges in many analytics approaches dealing with streaming data.
Making process data relevant at every level was next to impossible. Because of the above challenges, it was exceptionally difficult to measure KPIs in real-time at the machine level and provide guidance to operators guidance to improve their performance. At the other end of the stack, it was impossible to give CEOs, CFOs, and COOs relevant system-level KPI data below basic units of production. There was no way to capture crucial differences between machines (age, speed rating, status), production lines (estimated OEE at the line level) and real-time and aggregated OEE at the plant level based on real data.
How the Sight Machine KPI Dashboard for Manufacturing Enables Creative Solutions
New KPI Model, Widget, and Dashboards
To recap, Sight Machine KPI Model provides the following capabilities:
- Provides real-time updated KPIs which allow teams to track production numbers up to the minute
- Ties KPIs to underlying data models to make it easier to answer questions like “How does OEE differ from one supplier or plant to another?” or “How does humidity affect quality”?
- Enables objective comparisons of productivity across varied and dissimilar data sources (e.g., machines of different types, age, capacity, or throughput ratings)
- Empowers processes for network-level and enterprise-wide continuous improvement by making it easy to identify, visualize, and track variances from theoretical max
- An easy-to-configure single widget that helps operators focus on and understand their real-time performance and identify potential sources of problems or errors based on recent historical data.
- Quick configuration of KPI data and performance to match any reporting period.
These new capabilities unlock a host of new possibilities for solving production problems, tapping into teams’ collective insights, fostering knowledge sharing, and building healthy competition. Here are a few examples.
- Production Leaderboards: Building frequently updated leaderboards to encourage healthy competition by operator or by shift. Great teams enjoy competitions. The KPI Dashboard for manufacturing makes it simple to compare teams at a plant or across plants on a level playing field to measure performance objectively and fairly. Competitions can run on any metric, including production, quality, speed, or availability.
- Setting Up Mentorships: Every plant has operators that are recognized for their excellence and insights. The KPI Model can allow operators to easily see each other’s performance data and understand settings and all other parameters set by an operator. Operators recognized for excellence can use this to facilitate teaching and knowledge transfer to other operators.
- Weekly KPI Roll-Ups: Upper-level management can each week roll up all KPIs, identify outliers in either direction and quickly update or adjust forecasts to improve decision making. This can also be used to inform investors early if production numbers will miss expectations. In crisis situations like COVID, the ability to understand each day and week what’s happening becomes crucial for manufacturing resilience and continuity.
- Better Information Sharing With Customers: Manufacturers can more quickly let customers know earlier when an order will be late or will be completed ahead of schedule. This builds customer confidence and can help customers make smarter decisions for their business lines.
These are just four of the potential ways manufacturers can benefit from the increased transparency and real-time visibility provided by the Sight Machine KPI Dashboard for manufacturing. KPIs are the core of how productivity is measured, and any manufacturing productivity platform should facilitate the optimization of KPIs as analytical and decision-making tools. Information is the lifeblood of business. Delivering information more quickly and more accurately to everyone who needs to make decisions is crucial to driving productivity growth and improvements in any manufacturing enterprise.


