Paper manufacturer improves productivity
Summary
A large paper manufacturer was challenged by high scrap rates in its production mills. Implementing Sight Machine’s application suite enabled the manufacturer to analyze thousands of sensor readings for every machine that touched individual paper rolls throughout the production process. The manufacturer used this analysis to rapidly identify hidden relationships between production parameters and quality issues to reduce scrap rates and improve quality and yield.
The challenge
One of the largest global paper manufacturers was focused on building a scalable platform to analyze production data to address quality challenges. The manufacturer operates paper mills that take in bark and mix it with water and additives to create various grades of paper. A key initiative is improving profitability by addressing the 10-15% scrap rate of this continuously running process.
Collecting data was expensive and time-consuming
A data historian at each facility captures information from hundreds of PID controllers used throughout the production process. This data is forwarded to a cloud-based data lake for centralized storage of production data from multiple facilities.
No way to easily see relationships between data
Defect count/type data was captured at the last machine in the production process, the winder, but the manufacturer did not have the ability to determine which sensor readings from all the equipment involved in the production process related to a specific paper roll. This made it difficult to determine how individual or cumulative variances—for example, in pressure, temperature or tension—from one or more machines involved in the production process impacted the overall quality of a specific roll.
The existing pipeline only produces defects and aggregated historical machine data
Analysis was labor intensive and variable in quality
To investigate an issue, process engineers would make assumptions about which machines and parameters might be impacting quality, and query the data lake for a specific production run. They would then manually build data models associating sensor readings to specific production runs and apply algorithms to look for correlations and trends. Not only did this process need to be repeated for each inquiry, but the effectiveness of the data modeling was highly dependent on the skills and experience of each engineer.
Implementing Sight Machine’s application suite
The manufacturer was looking for a scalable IoT data analytics platform that continuously analyzed all data in real time rather than manually-selected, historical samples, allowing them to investigate and react faster. These needs aligned with Sight Machine’s approach of creating an accessible data platform built for analyzing readings and parameters from thousands of sensors and hundreds of machines.
Fast-track data modeling with AI Data Pipeline
Sight Machine’s AI Data Pipeline created Part and Quality models that allow process engineers to perform deep analysis of how the entire production process is impacting a batch of paper:
- First, Sight Machine pulls regular feeds of historian data directly from the customer’s Data Lake.
- The AI Data Pipeline then utilizes the inspection stamp from the last machine in the production process to establish a cycle event window and downtime boundaries to package the raw data captured by the data historian.
- These boundaries and the associated time stamps serve as the foundation for blending and joining data from multiple assets, systems, and sensors to create a production cycle data model.
- The ultimate output is a data model of all sensor and system readings that impact specific paper batches, asset downtimes, and rejects. This model captures all variables, for all cycles, for all machines, on an ongoing basis—creating an always available digital twin of the production process.
The new pipeline models all sensor readings and data relevant to the production cycles of the defective roll
Quickly diagnose issues with Sight Machine’s analytics
Leveraging the AI Data Pipeline models, Sight Machine’s analytics application allows process engineers to quickly diagnose quality issues.
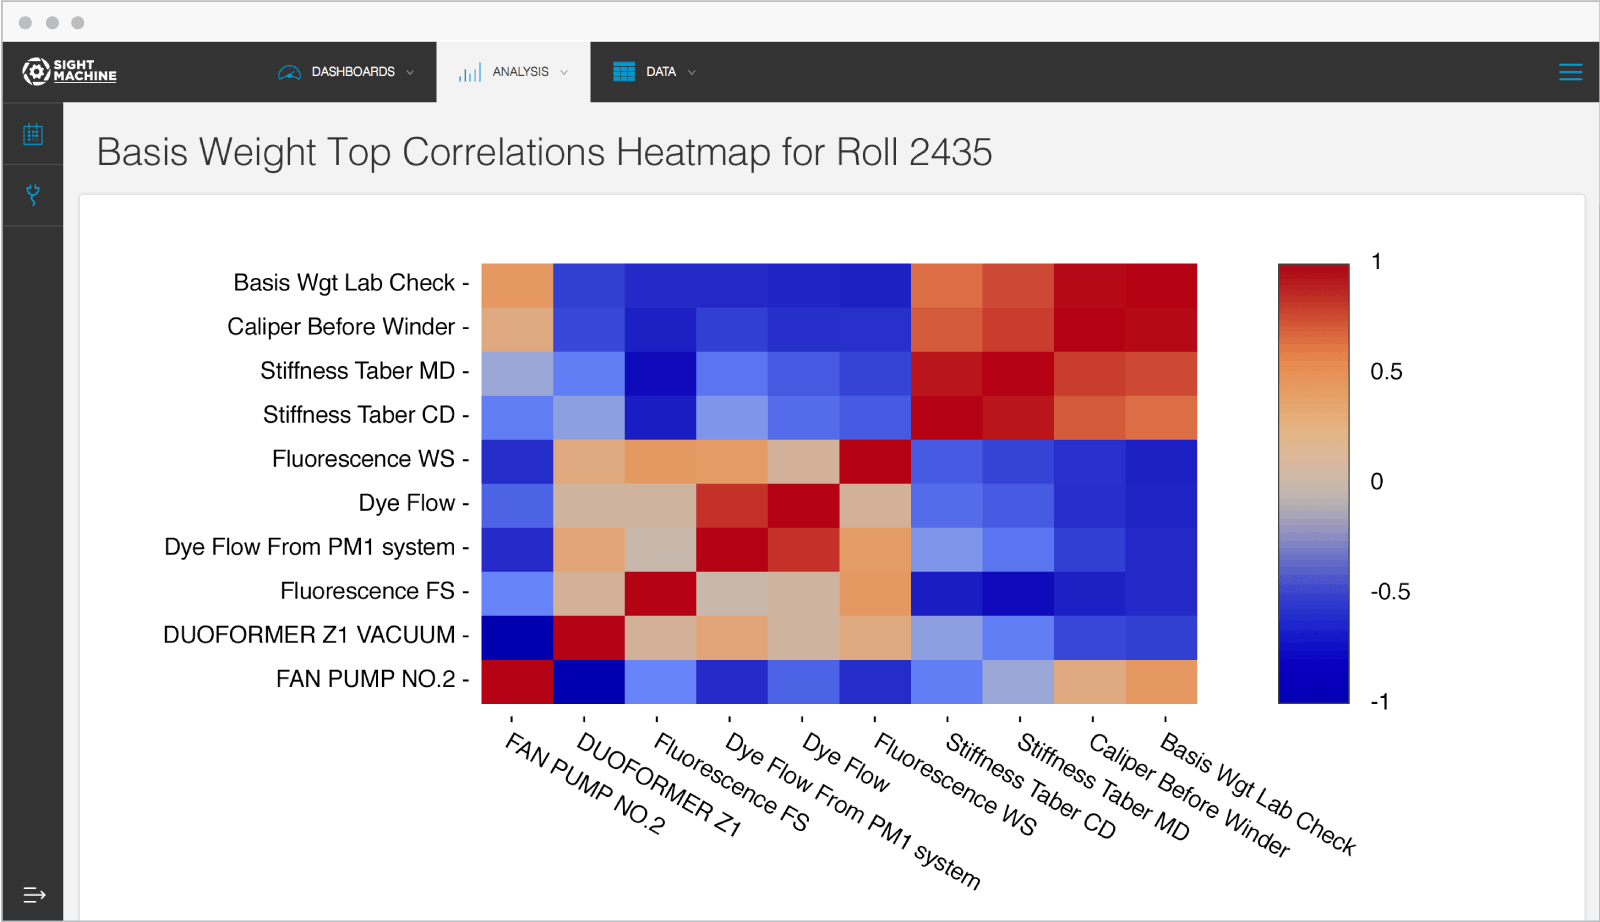
The Analytics Correlation Heatmap tool quickly determines which variables and machines might be impacting quality. Unlike the manual models and process created by data scientists, the Correlation Heatmap removes the guesswork by automatically analyzing tens of thousands of data points that relate to the production of a specific product.
Sight Machines Analytics Data Correlation Heatmap tool enables process engineers to rapidly identify hidden relationships between production parameters and quality issues
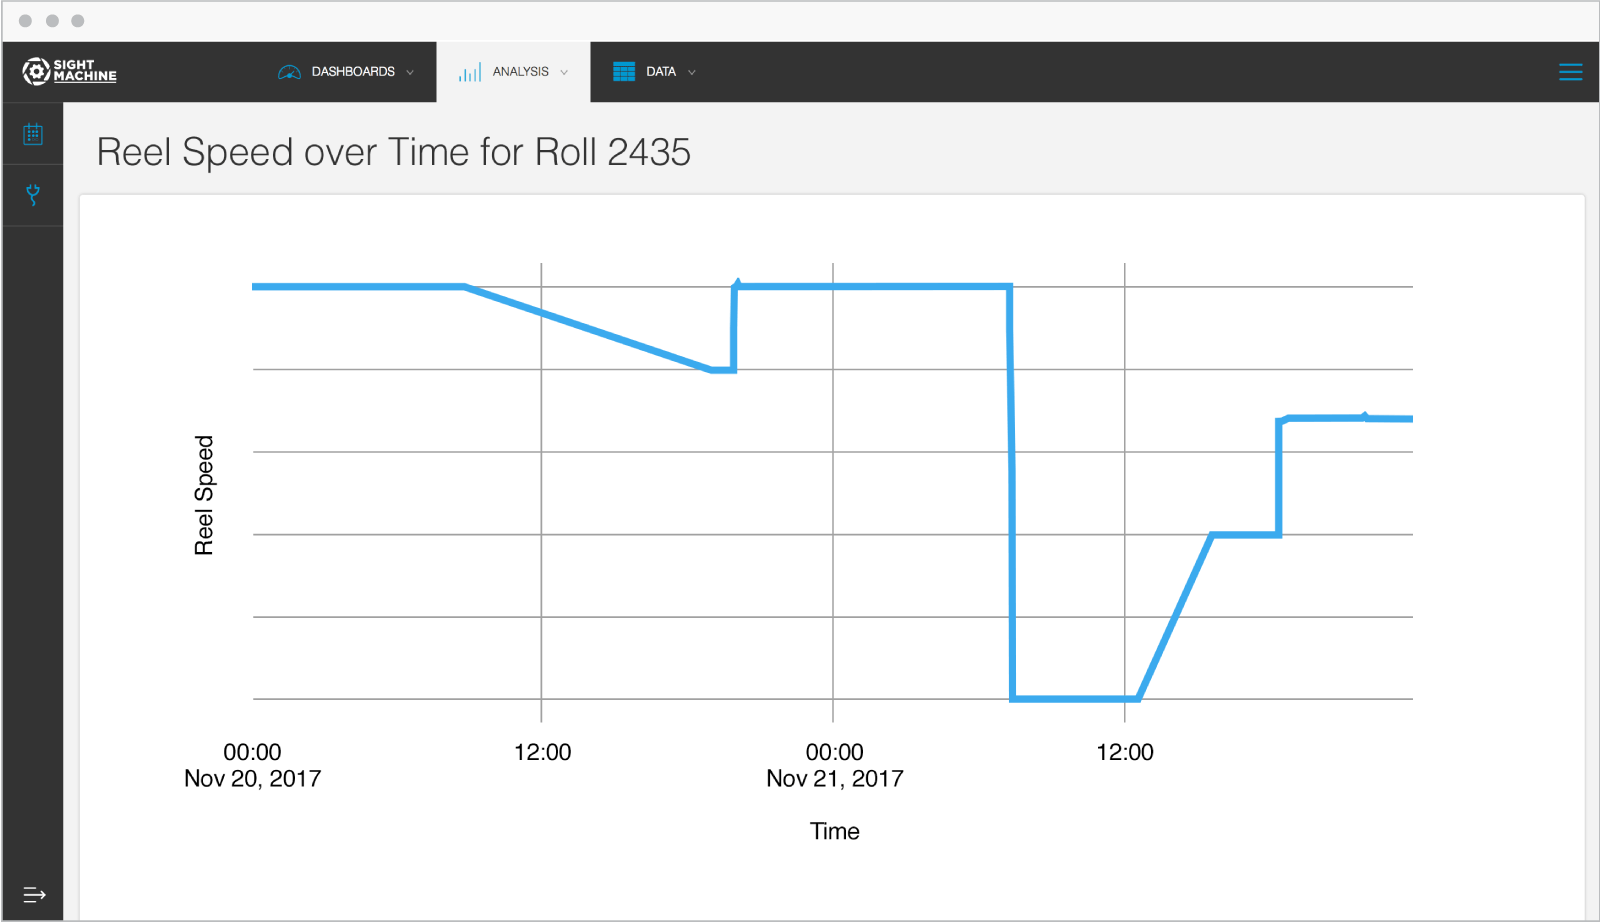
Once engineers have identified the most likely contributors to scrap, Sight Machine’s Advanced Analytics Toolkit enables the team to perform deeper analysis on the associated assets. In this case, the team analyzed dryer pressure and temperature readings for specific production cycles that generated a large amount of scrap to pinpoint the cause. Unlike manual data models which cover a set period of time, the team can verify their analysis by reviewing data from the same sensor during all scrapped runs using historical data.
All of this comes together to enable transformational levels of analysis providing the manufacturer with the ability to perform:
- Scrap identification and drill down
- Parts traceability
- Process and quality correlation
Sight Machines quality application process enables engineers to compare detailed sensor data activity to pinpoint issues
Data Architecture
Sight Machine’s Enterprise Manufacturing Analytics application suite pulls from the manufacturer’s data lake to deliver insights from data captured by multiple historians deployed at multiple facilities.
Additional Case Studies
Reducing Scrap in Industrial Manufacturing
Sight Machine helps a major industrial manufacturer reduce scrap costs by 30% within 3 weeks, identifying more than $500,000 in potential savings.
Improving Quality in Automotive Manufacturing
Sight Machine drives quality for a major global manufacturer by providing push-button multivariate root cause analysis on more than 60 data fields.