


With OEE Insight from Sight Machine, Metals Company Fixes 5% Scrap Rate
Overall Equipment Effectiveness (OEE) may be the gold standard for measuring manufacturing productivity, but if you scratch the surface of a typical plant OEE for Manufacturing report, you’ll find only a thin layer of gold plating.
 Sight Machine works with manufacturers around the world, and we’ve found that few of them have OEE visibility that’s accurate and consistently applied by plant managers. Fewer still can measure OEE automatically and quickly enough to spot and correct problems in real time.
Among the challenges these manufacturers face are lack of comprehensive data, slow or manual data reporting, and wide variations in how numbers are measured and reported. Not only is real-time OEE visibility difficult to achieve, but leaders who are compensated based on their plant performance have an incentive to make the numbers look good.
“Some companies want to meet their targets, so they touch the data 10 times to make it say what they want, instead of letting it say the truth,” said Dave Petrucci, Microsoft’s Manufacturing Industry Strategy Leader, in a recent Sight Machine webinar. “So many plants tell me, ‘Our OEE is about 82 percent.’ I look around and I can see it’s not true.”
For manufacturing leaders seeking genuine performance improvement, however, real-time OEE visibility is a powerful tool for identifying opportunities to achieve the best results. Sight Machine has helped companies around the world use OEE to deliver rapid, measurable, and sustainable performance improvements.
Fudge Factors
The basic formula of OEE for Manufacturing seems simple enough: Throughput times Uptime times Quality, each measured as a proportion (from 0 to 1.0) of the potential maximum. A factory making 100% of the maximum units per hour (1.0 throughput) with zero unscheduled downtime (1.0 uptime) and zero defective units (1.0 quality) has an OEE of 1.0 x 1.0 x 1.0 = 1.0. Whereas a factory making 90% of maximum units per hour, running 90% of the expected uptime and producing 90% salable units has an OEE of 0.9 x 0.9 x 0.9 = 0.729.
Within that simple formula, however, there are many ways for the numbers to go squishy. Should you, for instance, count maintenance time as downtime? Should you start measuring throughput only when the line gets to full speed? If the first 10 minutes of production typically must be scrapped, should you start measuring quality only after the first 10 minutes? And do you measure only downtime periods lasting at least a minute, and ignore the difficult-to-record halts of a few seconds?
Assessing OEE for Manufacturing Accurately
One of Sight Machine’s customers is a leading metal products manufacturer that faced skyrocketing demand. It wanted to increase production while maintaining the high-quality standards its customers required.

While the company’s equipment produced a lot of data, it had no way of using that data to understand its production process. One of its plants, for instance, has 400 metal forming lines that feed the intermediate products into the next processing steps that coat and bake enamel onto the raw material. Processing temperature and other environmental attributes are critically important for the product’s first pass yield. The sheer scale and variety of the data sources in the plant made it impossible to manually calculate OEE. In addition, before Sight Machine arrived, data generated by the plant was often late-arriving or missing.
Like many manufacturers, this plant’s only measure of performance was the amount of finished product it could produce. It didn’t measure its throughput against the theoretical maximum, couldn’t capture the short periods of downtime per shift, and its manual process of measuring quality wasn’t aligned to its measurement of productivity. Without OEE measurement, it was, therefore, unable to set a benchmark or create a plan to improve output. Manual reports, moreover, arrived late, making it difficult to identify problems in real-time. Given these challenges, the plant needed a software system to contend with billions of data points — one that could clean the data in real-time and provide granular OEE.
From Gut Instinct to KPIs
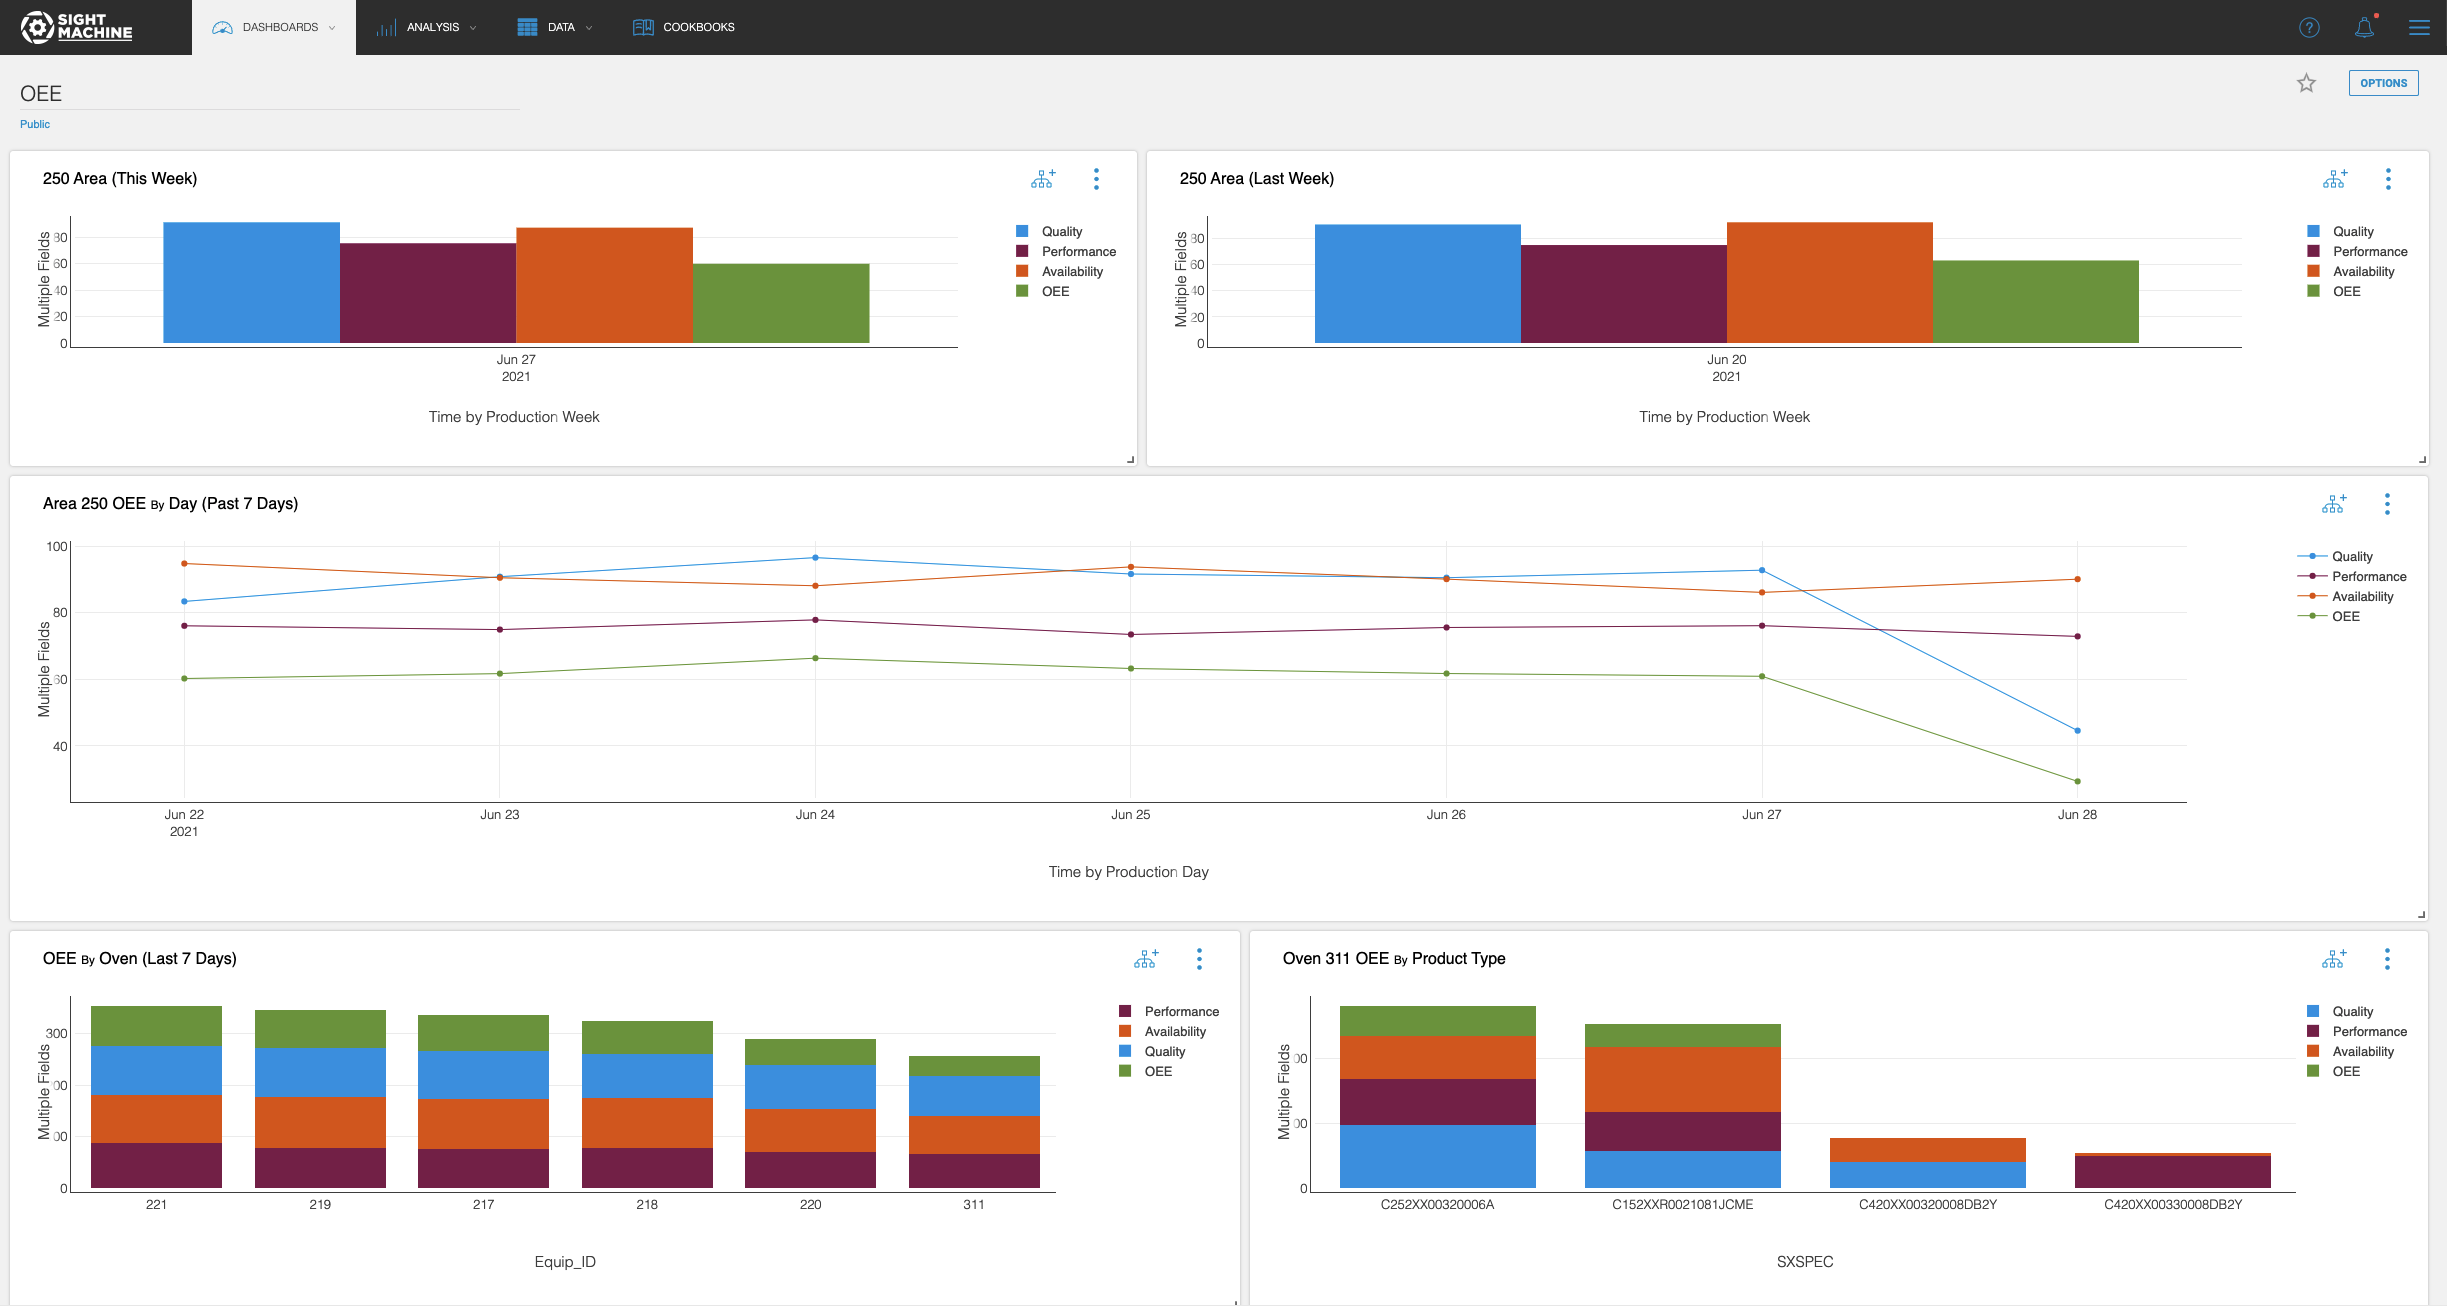
After creating a data foundation in Sight Machine, our team of solution architects and continuous improvement managers partnered with the plant to create an industry-standard OEE for manufacturing calculation based on first-pass yield. Before our arrival, the plant wasn’t tracking the productivity loss from reworking output that had failed quality control checks. Now, plant engineers use our software platform to see OEE components (throughput, availability, and quality) at the plant level or at the level of each individual machine line. The engineers can segment OEE by product type, or even by the operator, and can compare OEE across lines and ovens to identify problems.
If any measure of quality falls below spec, the plant engineers use Sight Machine’s correlation tools to pinpoint the cause of the problem.
The Problem
Plant engineers, for instance, observed increased out-of-specification surface unconformity defects that were causing 5% of the output to be scrapped. They at first struggled to identify the root cause of the problem. But they were able to use Sight Machine’s variation-analysis tools to find an abnormal variation in evaporation-zone temperature in the oven.
The Solution
Using Sight Machine, they identified a correlation between evaporation-zone temperature variation and the oven’s airflow-control mechanism. This problem would have been difficult to identify without Sight Machine’s tools and modeled data.
The Result: Zero Scrap

Sight Machine enabled them to resolve the problem, eliminating the defects that were causing 5% of the product to be scrapped, reducing the scrap rate to as low as 0%.
In the end, Sight Machine gave the plant a way to measure and improve its entire production process, said Calvin Kao, a Continuous Improvement Manager at Sight Machine who managed the project. Using Sight Machine’s platform, the plant engineers can now benchmark productivity and use that measure to visualize operations and establish data-driven goals. The plant manager has a data-driven way to optimize production, one that allows him to quickly identify problems, understand the root causes of the problems (quality, availability, or throughput), and know why they are happening (operators, product type, raw material, etc.), added Kao. The project at the plant was so successful that the company has decided to expand the use of Sight Machine’s productivity platform to its global network of plants.
“Whereas before the plant had relied on gut instinct,” Kao said, “they now have KPI’s to smartly guide all their operations.”


